Health & Economy Medicare Baseline Estimates
The Center for Health and Economy (H&E) is dedicated to assessing the impact of proposed reforms to the entire health insurance market. The following report details the first H&E baseline of the Medicare market with a focus on Medicare insurance choices, federal budgetary impact, and the premium landscape of health insurance for Americans over the age of 65.
KEY FINDINGS:
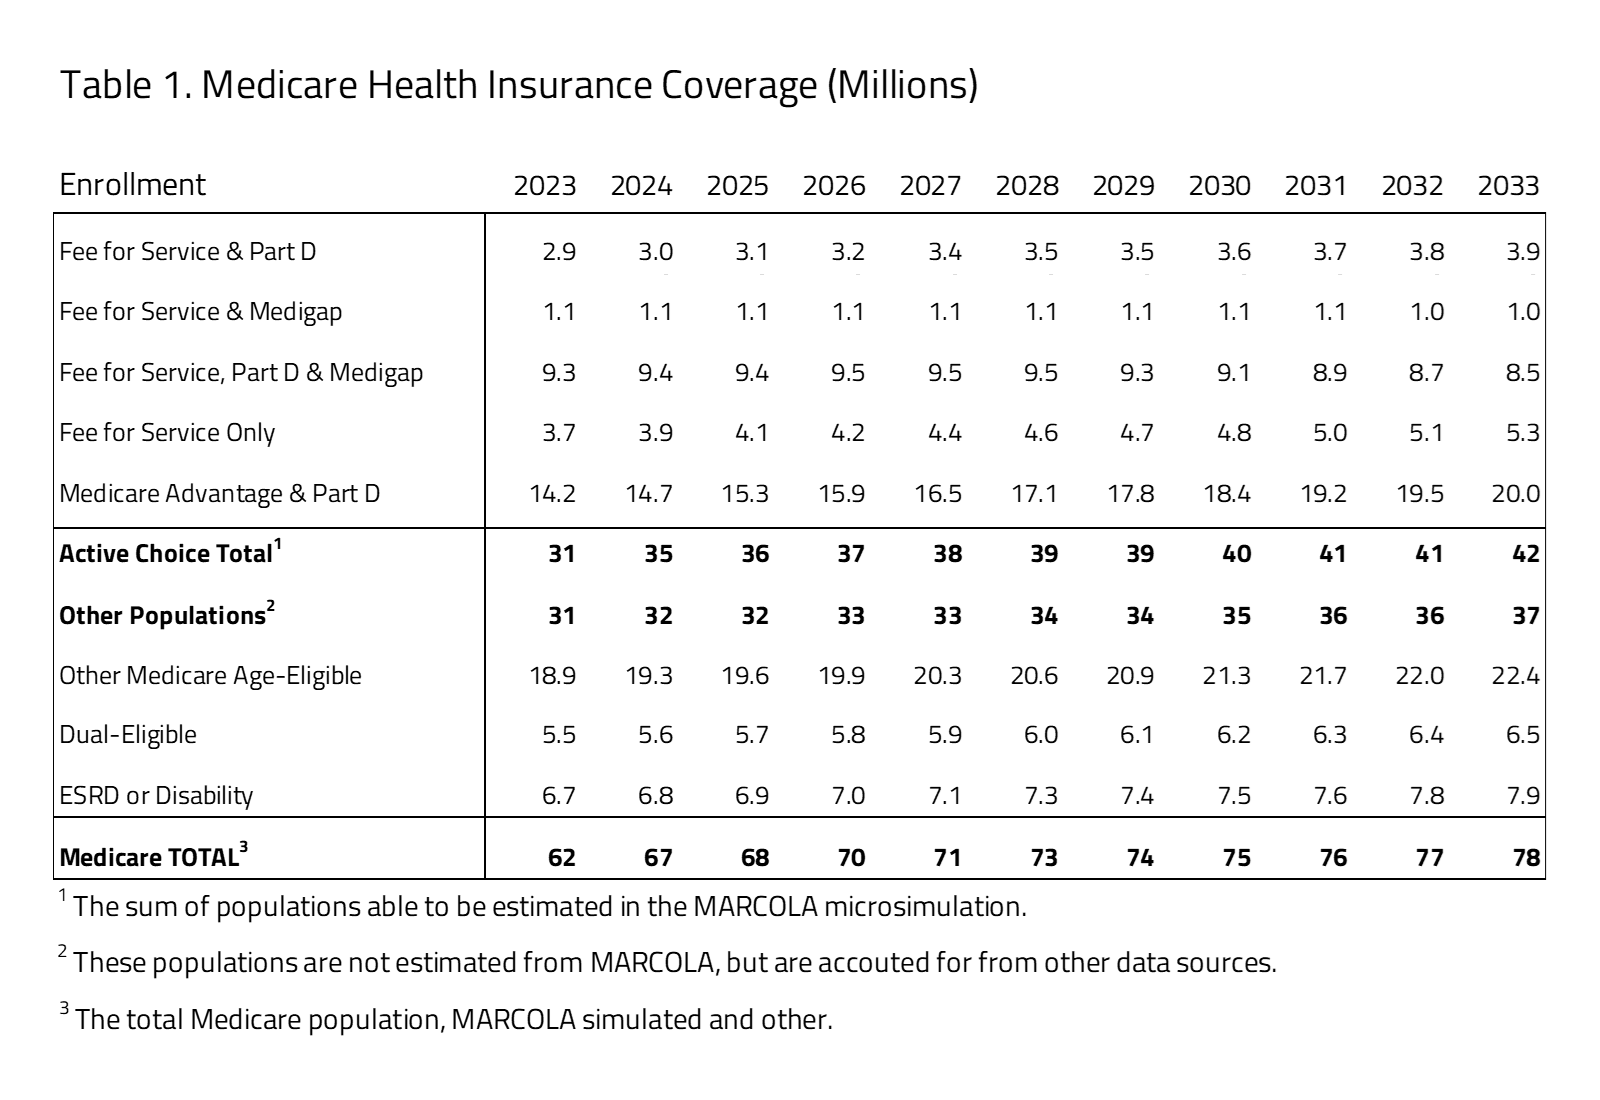
- The Medicare market includes an estimated 62 million U.S. residents in 2023, with 14.2 million covered in the non-employer facilitated Medicare Advantage combined with a pharmacy benefit. The total size of the Medicare market is estimated to increase throughout the budget window, growing to 78 million in 2033.
- Significant growth is projected in the Medicare Advantage market from 14.2 million in 2023 to 20.0 million in 2033 – a 42 percent increase. At the same time, Medicare fee-for-service (FFS), combined with supplemental Medigap benefit, is projected to decrease from 1.1 million beneficiaries in 2023 to 1.0 million in 2033. FFS combined with Part D and Medigap will have the biggest decline from 9.3 million beneficiaries in 2023 to 8.5 million in 2033.
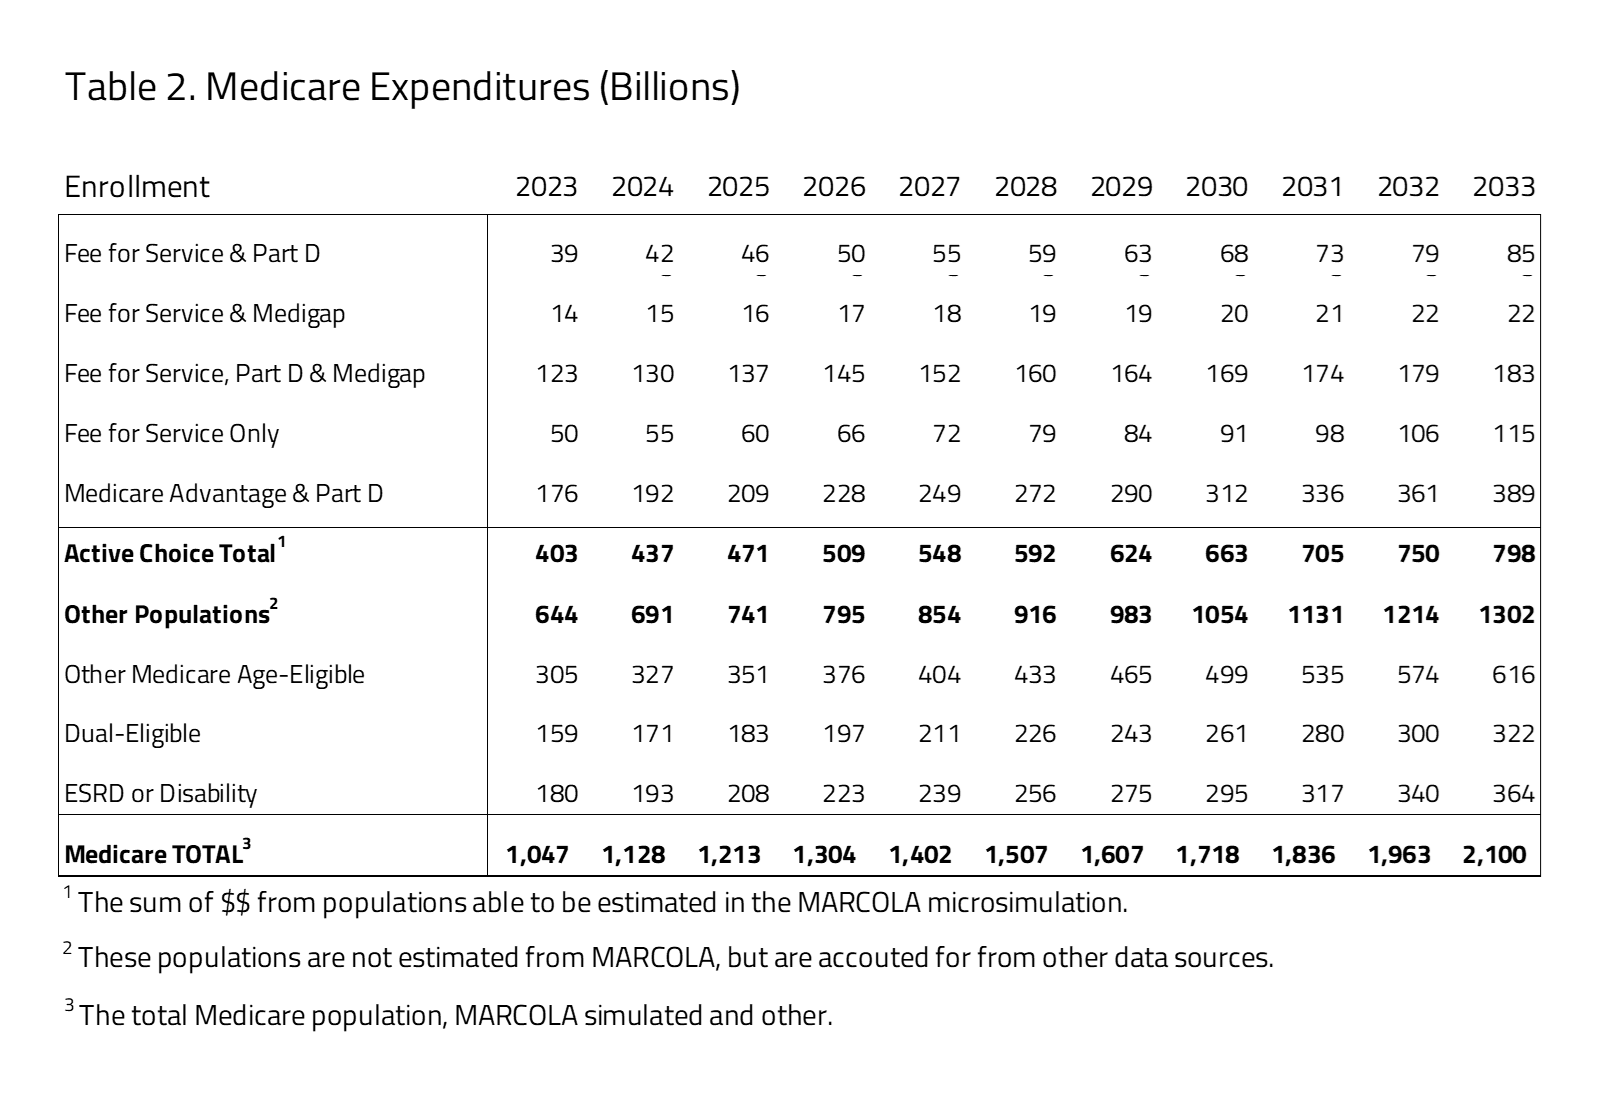
- Medicare program costs are expected to nearly double over the 10-year budget window, from $1.046 trillion to $2.098 trillion between 2023 and 2033. The health insurance Medicare coverage provisions under current law are estimated to have federal outlays of $16.8 trillion from 2023 to 2033.
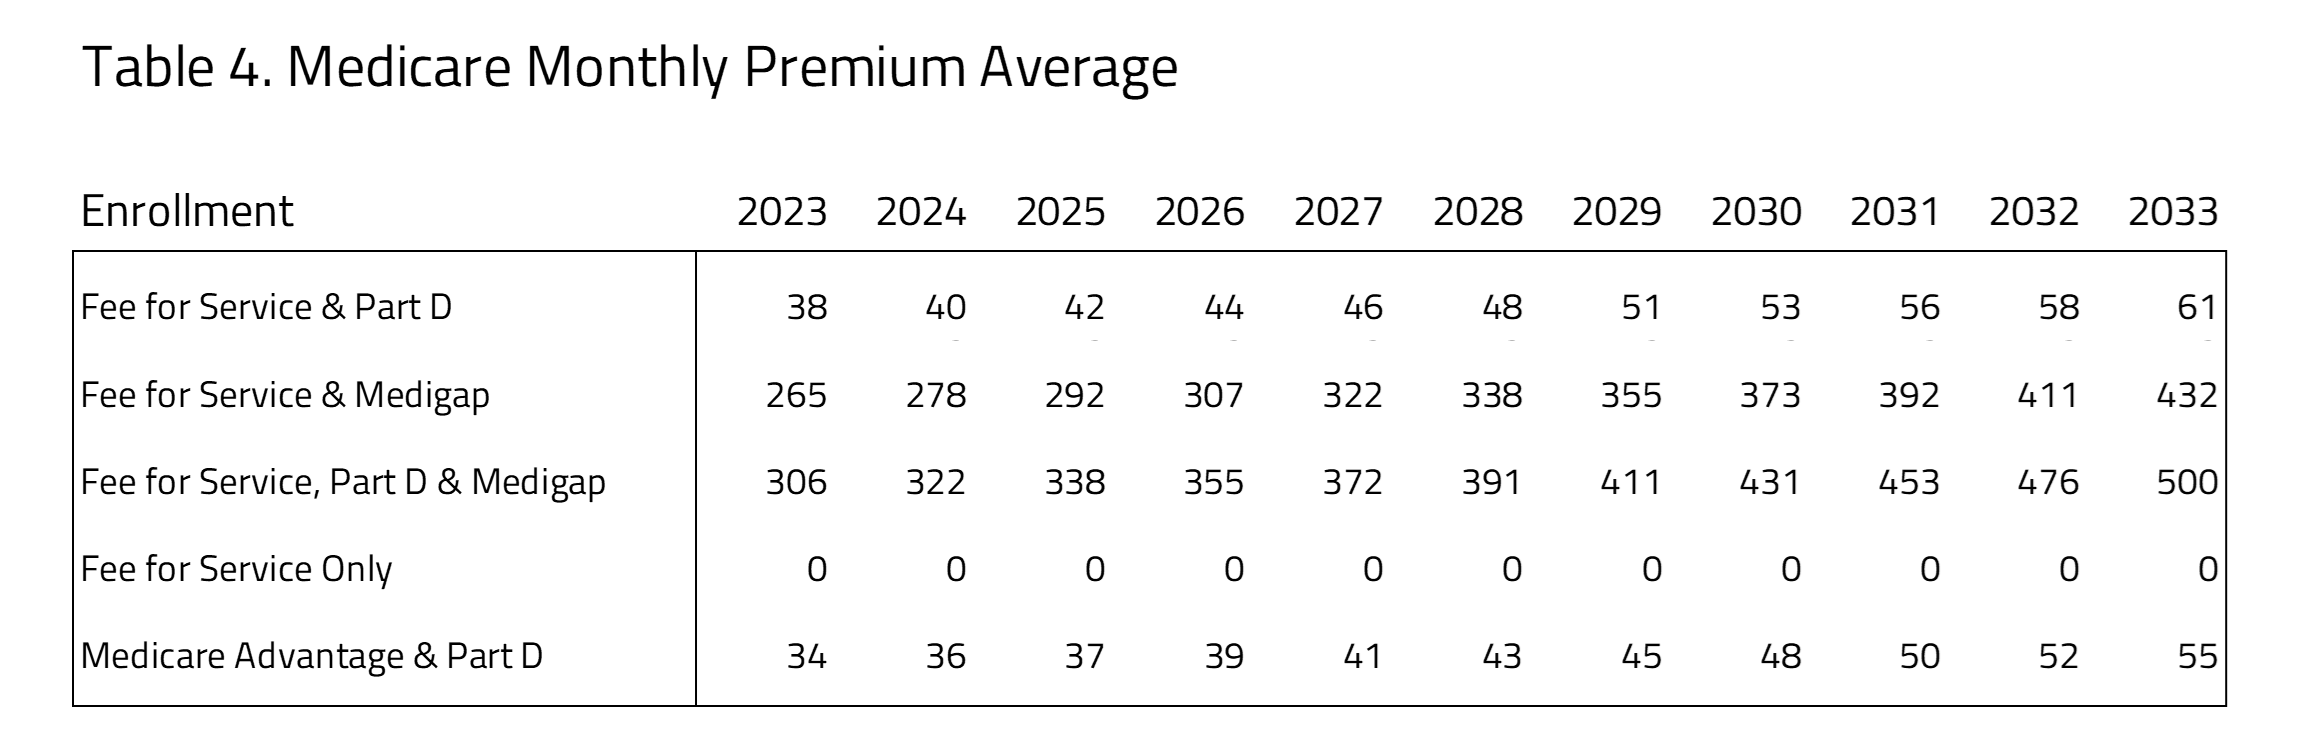
- Medicare premiums where Part D pharmacy benefits are included are the lowest for Medicare Advantage and Part D beneficiaries. The premium for this group is consistently lower than the beneficiaries choosing FFS and Part D for all 10 years estimated. Medicare premiums are the most expensive for those selecting FFS and Part D and Medigap supplemental insurance coverage.
INSURANCE COVERAGE
H&E estimates there are 62 million U.S. residents with Medicare insurance coverage in 2023. Table 1 provides a 10-year estimate of Medicare enrollment. Within the Medicare population, H&E’s microsimulation separates two major populations. The first is the one directly affected by consumer choices for Medicare Advantage, Part D, or supplemental Medicare policies (i.e., Medigap). The second population consists of consumer groups with eligibility-specific incentives that may affect their choices in ways that H&E’s microsimulation does not currently capture. It includes the Medicaid eligible population (i.e., dual eligible), the Medicare disabled and end-stage renal disease (ESRD) populations, and Medicare recipients that receive employer-sponsored retirement benefits. The first population constitutes half of the Medicare market with 31 million beneficiaries in 2023. The second population is not modeled in microsimulation estimates. Instead, we use national account data from the Centers for Medicare and Medicaid Services (CMS) and the Census to project these beneficiaries’ Medicare enrollment. This second group also includes individuals under the age of 65 who are disabled or using the ESRD benefit. The overall size of the second population is approximately 31 million in 2023.
Within the active-choice first group of Medicare beneficiaries, there are five product groups, representing combinations of fee for service (FFS), Medigap, Part D pharmacy benefit, and Medicare Advantage. The most popular product group is Medicare Advantage and Part D with 14.2 million beneficiaries. This group will increase to 20 million by 2033. The FFS and Part D product group will grow by 1 million from 2023 to 2033. Also, the FFS only group grows from 3.7 million beneficiaries in 2023 to 5.3 million beneficiaries in 2033. The FFS and Medigap, FFS only, Part D and Medigap product groups will decrease by a little over 1 million combined by 2033.
BUDGET
H&E estimates the impact on the federal budget of the major health insurance coverage provisions of current law with regard to the Medicare population. Budget impact estimates do not include estimates for Medicare expenditures not directly related to care, such as Graduate Medical Education or other program costs related to Center for Medicare and Medicaid Innovation demonstration expenditures.
Ten-year Medicare projected expenditures are presented in Table 2. Over the decade spanning between 2023 and 2033, H&E estimates that elderly coverage provisions under current law will cost $16.8 trillion. Medicare costs associated with the first population of Medicare active choice consumers have an expenditure of $403 billion in 2023 that will grow to $798 billion in 2033. The largest product within this group is the Medicare Advantage population with expenditures growing from $176 billion in 2023 to $389 billion by 2033. The non-active choice, second group has a total expenditure of $644 billion in 2023 that will grow to $1.3 trillion by 2033.
PER-CAPITA EXPEDITURES
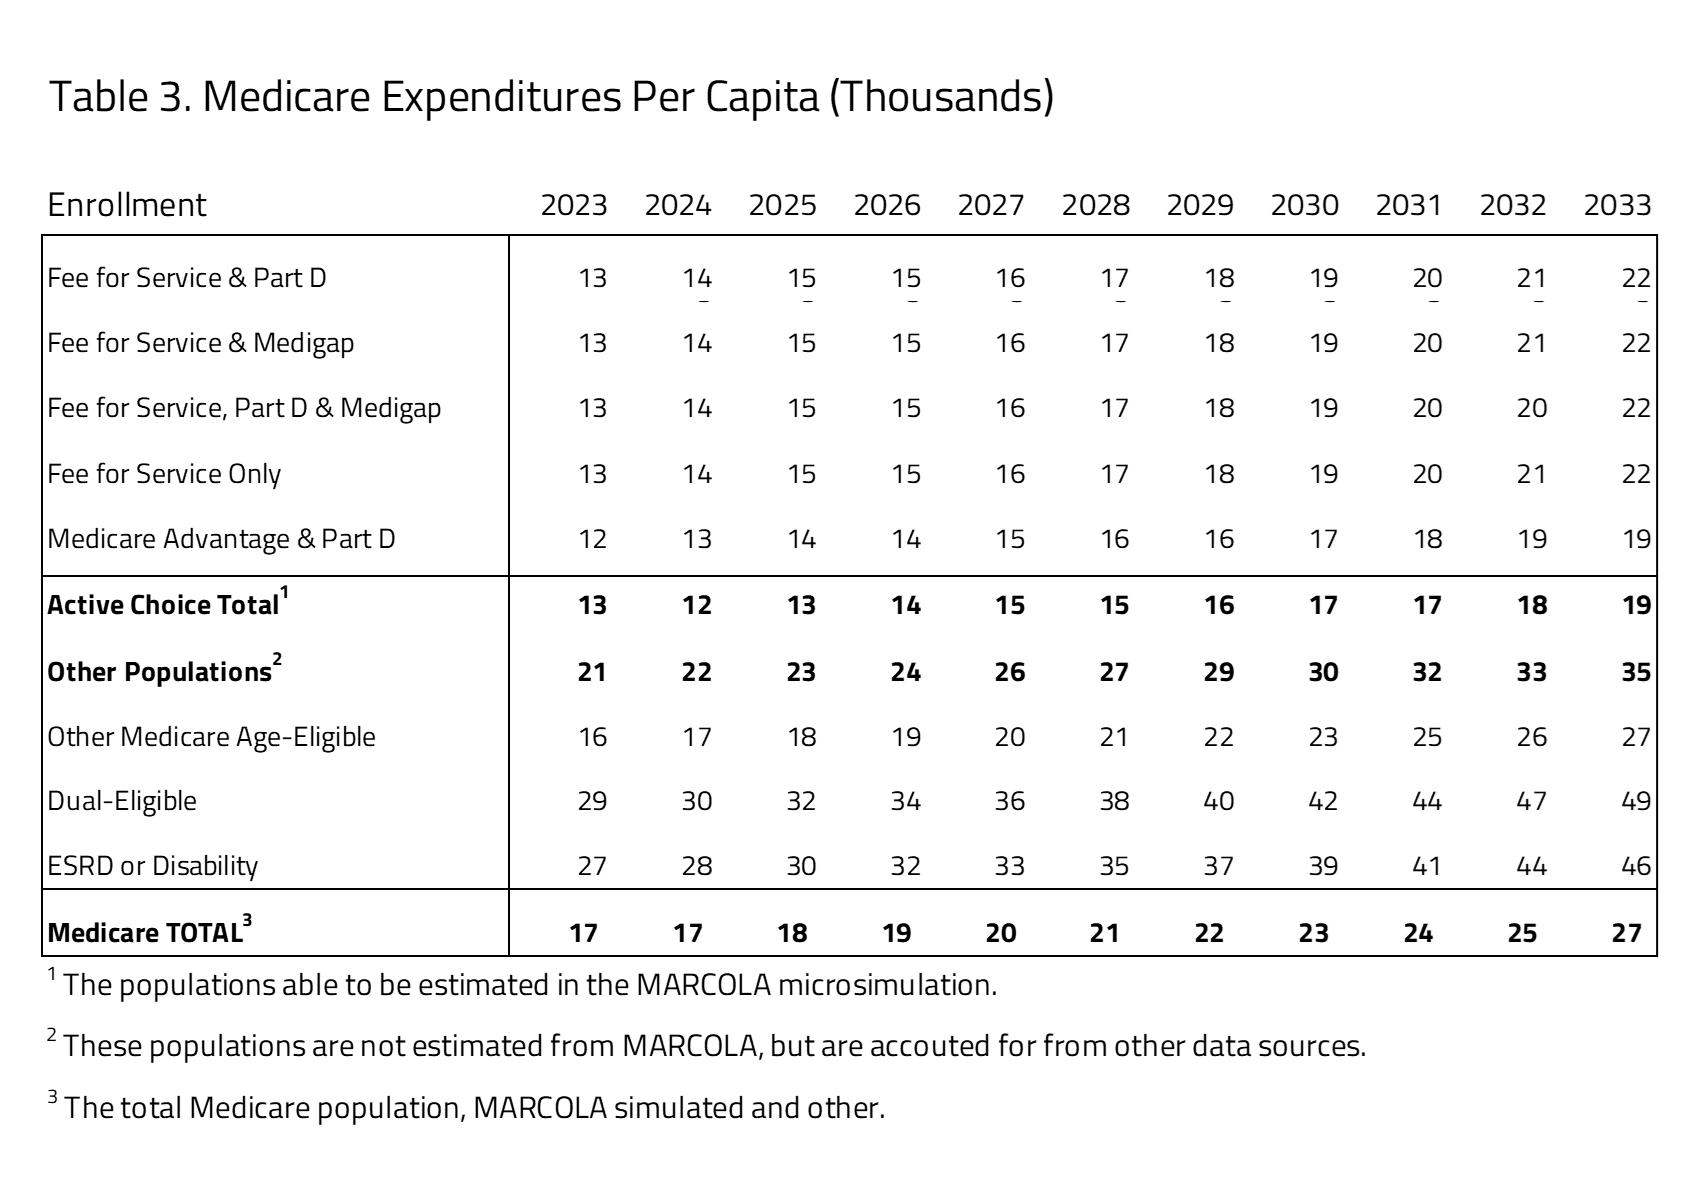
Using the project Medicare beneficiary population size and expenditure, H&E estimates the per-capita cost of each Medicare program category. As seen in Table 3, the active-choice Medicare consumer choice group there is little variation between the subgroups. The one significant difference is in the Medicare Advantage and Part D subgroup, where average per-beneficiary cost is $12,000 in 2023, compared to the other groups’ $13,000 average cost. This difference is maintained throughout the budget window with costs for Medicare Advantage and Part D averaging $20,000 by 2033 and the other subgroup, including all the FFS choices, having higher average per-beneficiary costs of $22,000 in 2033.
The second group of Medicare beneficiaries, projected but not active choice, has significantly higher per-capita costs. The largest per-capita cost within this subgroup is the dual-eligible population, followed by the ESRD and disabled population, with 2023 per-capita costs of $29,000 and $27,0000, respectively. The other Medicare age-eligible group is most similar to the group with Medicare choices, with lower subgroup costs of $16,000 in 2023.
MEDICARE PREMIUM ESTIMATES
In Table 4, H&E presents the Medicare premiums for the “active choice” consumers. The five subgroups that we have profiled represent those where the consumers will choose which plans they will participate in. This table does not include populations where the program is either organized by an employer. The table also does not include populations that are disabled, enrolled in Medicaid or participating in the ESRD program. The data sources for this information are a mix of public and private. They have been validated using recently reported information in Medicare premiums, however. The premiums for FFS and Part B compared to Medicare Advantage and Part D are roughly comparable throughout the 10-year window. The least expensive of the Medicare plans with Part D coverage is the Medicare Advantage plus Part D plan. The most expensive of the options for consumers is FFS plus Part D and Medigap.
UNCERTAINTY IN PROJECTIONS
H&E uses a peer-reviewed micro-simulation model of the health insurance market to analyze various aspects of the health care system. As with all economic forecasting, H&E estimates are associated with substantial uncertainty. While the estimates provide a good indication of the nation’s health care outlook, there is a wide range of possible scenarios that can result from policy changes, and current assumptions are unlikely to remain accurate over the course of the next 10 years.
THE MARCOLA MICROSIMULATION
This simulation builds on the ARCOLA simulation work done by H&E for the under-65 market and has been published externally since 2013. The primary objective of MARCOLA (Medicare ARCOLA) is to estimate future proposed changes to the Medicare program through a set of policy briefs to inform Congress and the executive branch.
This project entailed building micro-simulation models to address how many seniors will be affected with respect to their health plan choices and out-of-pocket expenses, as well as the cost to the federal government. The project involves estimating a comprehensive demand model for the Medicare population that accounts for all possible choices: Medicare only, Medicare with Part D drug coverage, private MA plans with and without drug coverage, and private supplementary insurance (“Medigap”) with and without Part D.
A novel attribute of the simulation is the MA plan bid from CMS and premium data from at least one large Medigap insurer. In addition, we utilize the most recent years of the Medicare Current Beneficiary Survey for estimation of the models and the Medicare National Claims History File data to establish baseline trends for health care cost projections.
We use a set of limited dependent variable estimation models to build a prediction engine, taking into consideration out-of-pocket plan premiums, other plan attributes, and beneficiary socio-economic attributes. This will permit the opportunity to vary premium and income effects to gauge effects on beneficiaries in the simulation model.
Additional information on the MARCOLA model and assumption made can be requested from H&E.